
The platform
Vea
Software that turns a cardiovascular imaging dataset into patient-specific anatomy you can explore, measure and, when it helps, step inside.
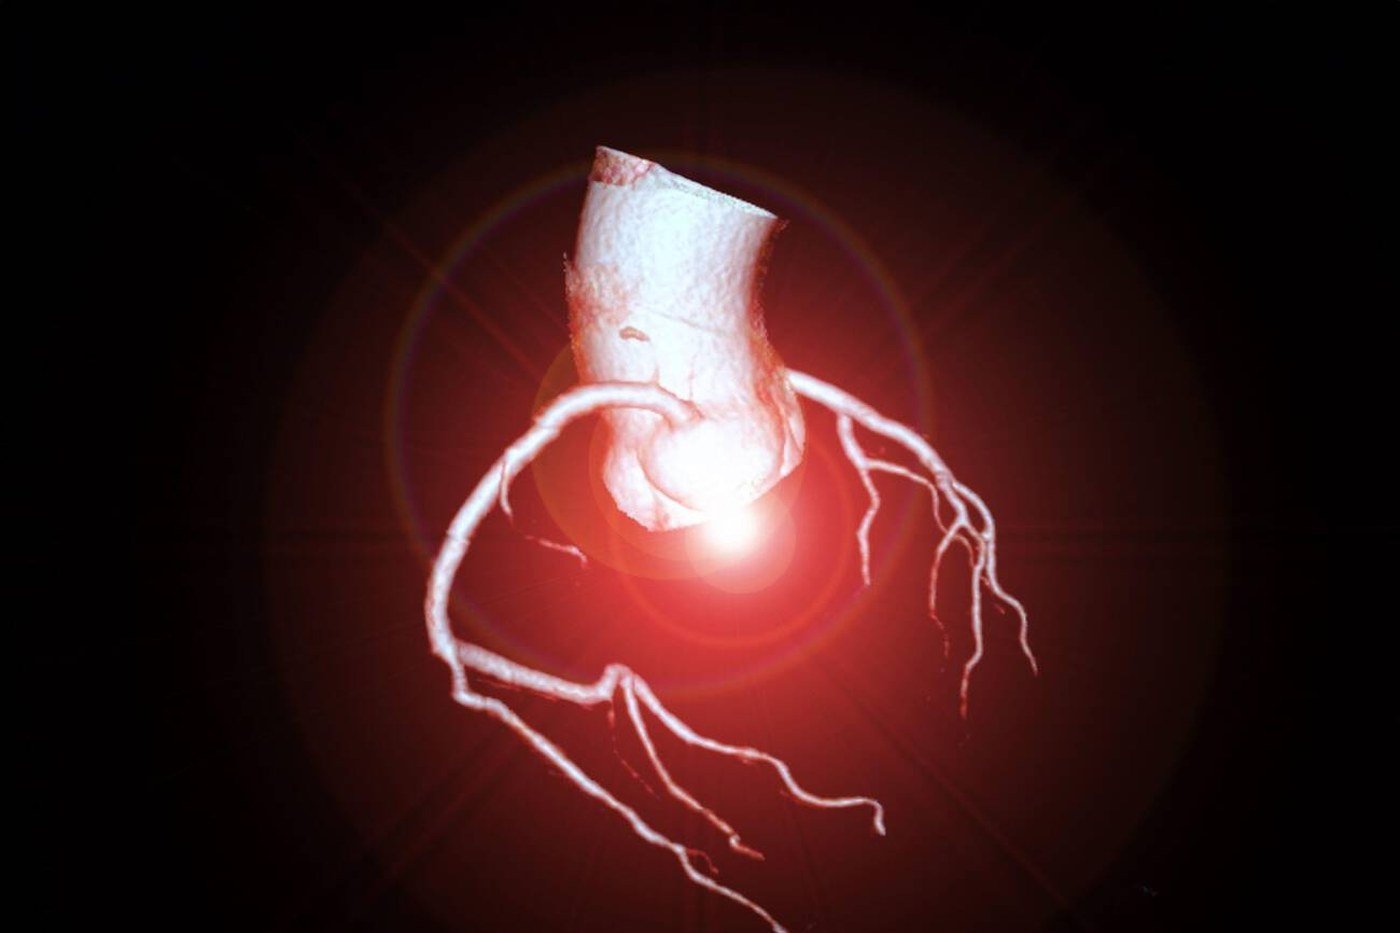
What it does
Seven things, done properly
Vea is deliberately narrow. It is built for cardiovascular anatomy and for the small number of tasks that anatomy actually demands, rather than being a general imaging suite with a 3D button attached.
- Patient-specific 3D reconstruction
- Immersive virtual reality
- Medical image exploration
- 2D and 3D measurement
- Virtual implant positioning
- Congenital and structurally complex anatomy
- Imaging workflow and PACS
Patient-specific 3D reconstruction
A compatible DICOM series becomes a three-dimensional model of that particular patient — not a generic atlas, not an illustration. Rotate it, clip it, isolate a chamber or a vessel, and look at the structure from the direction the question demands rather than the direction the scanner happened to use.
- Interactive reconstruction from the original series
- Clipping planes, thresholds and structure isolation
- Saved views that can be restored and shared with a colleague
Immersive virtual reality
The same reconstruction, viewed at true scale from inside. Depth and relative position stop being something you infer from a series of slices and become something you simply see. For teams, it also solves a smaller but persistent problem: everyone is looking at the same thing, from the same place, at once.
- True-scale exploration of the reconstructed anatomy
- Intuitive sense of depth, orientation and spatial relationships
- Well suited to case conferences and teaching sessions
Medical image exploration
The three-dimensional view never replaces the source data. Vea keeps the reconstruction and the original CT, MR or 3D echocardiography series alongside each other, so anything seen in the model can be traced back to the image it came from — which is the difference between a visualization and a picture.
- Review of CT, MR and 3D echocardiography datasets
- Standard DICOM series as the input, without a bespoke acquisition
- Cross-reference between the 3D scene and the source slices
2D and 3D measurement
Diameters, distances and areas, taken either in the conventional 2D views or directly within the three-dimensional scene. In a research setting the value is less in any single number than in being able to define a measurement precisely enough that a second reader produces the same one.
- Diameters, distances and areas in 2D and in 3D
- Measurements taken on the reconstruction the reader is actually looking at
- Suited to protocol-driven work across a retrospective series
Virtual implant positioning
A device or implant can be positioned virtually inside the patient-specific reconstruction to study how it relates to the surrounding anatomy. This is a spatial and educational exercise: Vea does not select a device, does not recommend a size and does not evaluate whether a procedure should happen.
- Study of fit, orientation and clearance within reconstructed anatomy
- Useful for research, rehearsal discussions and teaching
- Explicitly not a treatment-planning or device-selection function
Congenital and structurally complex anatomy
This is where three-dimensional review earns its keep. Congenital malformations and staged surgical repairs produce spatial arrangements that no standard view was designed to show, and that a written report struggles to convey. Being able to hand a colleague the structure itself changes the conversation.
- Malformed, repaired and post-surgical cardiovascular anatomy
- Conduits, baffles and anomalous vessel courses
- Teaching cases that are hard to explain on a flat display
Imaging workflow and PACS
Where the hospital environment technically allows it, Vea can be connected to a compatible PACS so cases arrive without a manual export step. What is possible depends entirely on your infrastructure and on your own information security rules, so we scope it with your IT team rather than promising it in advance.
- Access to datasets from a compatible PACS environment where supported
- Scoped together with your IT and information security teams
- Manual DICOM import always available as the baseline
Practicalities
What it runs on, and what it reads
Vea is a desktop application. The three-dimensional and immersive work is done locally on a graphics card, which is what keeps interaction responsive on datasets of a realistic size.
If you are unsure whether an existing workstation is adequate, send us its specification before you buy anything — we would rather tell you it is not than have you discover it in a session.
- Imaging input
- CT, MR / MRI, 3D echocardiography
- Data format
- Compatible DICOM datasets
- Operating system
- Windows
- Graphics
- Current NVIDIA GPU
- Interaction
- Desktop with mouse and keyboard; immersive VR
- Integration
- Compatible PACS environments, where supported
- Intended use
- Research, education and visualization
Boundaries
What Vea is not
A visualization tool that is honest about its limits is more useful than one that is not. This is the part of the specification we would rather you read twice.
Not a certified medical device
Vea is not CE marked under the EU Medical Device Regulation and has not been cleared or approved by the U.S. Food and Drug Administration. It is supplied for research and educational use.
Not a diagnostic system
It does not detect, identify or grade disease, and it produces no diagnostic output. Diagnosis remains a matter for qualified clinicians working with the source images.
Not a treatment planner
Virtual implant positioning is a spatial exercise. Vea does not select a device, does not recommend a size and does not evaluate whether an intervention is appropriate.
Not a substitute for judgement
Nothing produced in Vea replaces clinical assessment, established imaging review or the responsibility of the treating team. Any clinical decision stays with them.
See it on a case of your own
A demonstration runs about forty minutes. Bring an anonymized dataset and we will work with that instead of a prepared example — it is a far better test of whether this is useful to you.